Lab 4 - Running jobs on the cluster
Introduction
Welcome to the jobs lab. In this session we're going to take the training wheels off and let you write and optimize your own job scripts (a.k.a. batch scripts).
We'll also acquaint ourselves with different ways of getting info about the cluster, cover monitoring a job's resource usage, and practice debugging in an interactive srun session.
Getting to know the cluster
In this section you'll learn about the structure of the cluster and the commands that give you information about it.
A good primer on the subject can be found on our documentation page here.
Complete
You should familiarize yourself with the concepts on the page linked above
Additionally, try running the commands listed there and make sense of the output.
Hint: to get less of a wall of text, you can the scontrol show partition command individually for each partition by appending the partition name, such as scontrol show partition intel.
Now that you've seen the partitions, lets take a look at the nodes that comprise them. A useful tool for getting a glance of the state of the cluster is the slstat command. It prints out information about each node in the cluster, by default with the following fields:
| Field | Content |
|---|---|
| Name | Name of the node |
| State | State of the node. Can be idle, mixed, allocated, reserved, draining, drained or down |
| CPU info | Total number of CPU cores on the node and how many of them are available |
| Load5 | System load averaged over 5 minutes. Load over no. of CPUs on machine means processes are waiting in queue and the system is overloaded |
| Memory free | Total and available RAM on the node |
| Username:JobId | The jobs currently running on the node |
Info
Further info on the different states nodes can be in:
- Idle means the node is up and has no jobs allocated to it.
- Mixed means the node has jobs allocated, but still has resources available for additional ones.
- Allocated means that all of the nodes resources are allocated to jobs.
- Reserved means the node is part of some reservation and not currently accessible to the general queue.
- Draining/Drained means the node is being pulled out of the queue and is no longer accepting new jobs. Usually a sign that maintainance is about to be done on it.
- Down means that the node is taken out of the queue for repairs.
You can explore further options of slstat with
slstat --help
Simple jobs using srun and sbatch
From the login node, resources on compute nodes can easily and directly accessed through srun. This command tells the resource scheduler Slurm to execute the command that comes after it on some node or nodes that fits the parameters you specify. This can be easily verified by using the command hostname, which reports the name of the node that the command is executed on. Execute the following commands to confirm this:
hostname
srun -p main -A <your_account> hostname
The outputs should differ with the first reporting one of the login nodes and the second reporting one of the ares or artemis nodes. By default 1 process is scheduled on 1 node. We can schedule multiple processes with the -n or --ntasks flag. Adding this flag to previous command we get srun -p main -A <your_account> -n 2 hostname, we should get 2 lines of output reporting the hostname. Furthermore, if you have a task that is computationally large enough, multiple nodes can be requested. The corresponding flags for this would be -N or --nodes for the count of nodes to be used and --ntasks-per-node for number of tasks for each node. The last command we ran likely reported the same hostname twice. However, if we were to increase -n to 300, different hosts would be reported. To run 4 processes on 2 nodes, you can schedule it for example like this srun -p main -A <your_account> --ntasks-per-node 2 --nodes 2 hostname.
Executing these commands, you have to wait until the job gets completed without closing the session, otherwise the job will get cancelled. To place the job into the queue to be scheduled for execution in the background, we have batch scripts and the command sbatch. The last command as a batch script is provided below with the addition of a regular hostname to the srun hostname.
batch_hostname.sh
#!/bin/bash
#SBATCH -A <your_account>
#SBATCH -p main
#SBATCH --ntasks-per-node 2
#SBATCH --nodes 2

echo "just hostname"
hostname
echo "srun hostname"
srun hostname
You can schedule this job by issuing the command sbatch batch_hostname.sh after saving the file. After the job has run, you should see a file slurm-<jobid>.out. The commands in the batch script are executed on the first node allocated to your job. Thus in the output file, the output of just hostname will not be loginX, but one of the nodes in the partition you specified. Then, the srun hostname will (by default, unless specified otherwise) fetch the parameters specified in the #SBATCH lines and execute the command. The output should be the same as in our previous test.
Array jobs
Have you ever had to submit hundreds of jobs that only differ by one parameter? Instead of looping a sbatch submitter script, array jobs are the simpler solution for this.
Array jobs allow You to specify an extra parameter in sbatch named --array that can accept an integer range that will then be converted to $SLURM_ARRAY_TASK_ID inside the sbatch script. This allows for quick loops over large datasets, potentially submitting thousands of jobs in a single step. The array job will have one main job id, and the sub-task id will be specified with _<array task id>. Further reading can be found at the official SLURM documentation site
We will now run through a quick demonstration of using arrays
First, we create a simple sbatch task under lab4/array_job/
#!/bin/bash

#SBATCH --partition=amd
#SBATCH --time=10
#SBATCH --ntasks=1
#SBATCH --cpus-per-task=1
#SBATCH --array=0-15%4
#SBATCH --account=<your etais allocation>

echo $SLURM_ARRAY_TASK_ID
sleep 5
The idea of the script is quite simple, we just echo the value of the array task id. Our scoring will pick up the generated output files and match if all 16 tasks ran successfully.
One thing to note here, is the % modifier for the task, this allows us to specify parallelisation on a task level, namely the number 4 here says that a maximum of 4 tasks are allowed to run concurrently. This parameter can be tuned to your liking if you are submitting non-test jobs.
We submit the job with sbatch, and then we can see some additional information for the array job
Firstly, scontrol show job <id> will now specify that it is an array job. We can see a similar change in the output of squeue
[alk@login1 lab4]$ scontrol show job 48501886 | grep -i arr
JobId=48501886 ArrayJobId=48501886 ArrayTaskId=0-15%4 ArrayTaskThrottle=4 JobName=array_submit.sh
PS:Replace the username "alk" with your own when checking queue status
[alk@login1 lab4]$ squeue -u alk
             JOBID PARTITION     NAME     USER ST       TIME  NODES NODELIST(REASON)
 48501886_[0-31%4]       amd array_su      alk PD       0:00      1 (None)
squeue will report that it has hit the JobArrayTaskLimit. This means that 4 jobs are running concurrently and the limit specified by %4 has been reached. [alk@login1 lab4]$ squeue -u alk
JOBID PARTITION NAME USER ST TIME NODES NODELIST(REASON)
48501886_[8-31%4] amd array_su alk PD 0:00 1 (JobArrayTaskLimit)
Should we wish to change this limit during runtime, it is entirely possible with
scontrol update jobid=<job id> arraytaskthrottle=<new value>
We can also get a more detailed overview of the array status by listing all of the sub-tasks in the array using squeue -r
[alk@login1 lab4]$ squeue -u alk -r
             JOBID PARTITION     NAME     USER ST       TIME  NODES NODELIST(REASON)
        48501886_8       amd array_su      alk CG       0:21      1 ares1
       48501886_29       amd array_su      alk PD       0:00      1 (JobArrayTaskLimit)
       48501886_30       amd array_su      alk PD       0:00      1 (JobArrayTaskLimit)
...
       48501886_31       amd array_su      alk PD       0:00      1 (JobArrayTaskLimit)
        48501886_9       amd array_su      alk  R       0:21      1 ares1
       48501886_10       amd array_su      alk  R       0:21      1 ares1
       48501886_11       amd array_su      alk  R       0:21      1 ares1
Once the job has finished, we will see 16 Slurm output files under lab4/array_job/ and our scoring check should turn green.
More keen-eyed of You might have noticed that sadly, array jobs will only iterate over integers. The solution to this would be to write a small mapping script that can convert an integer value to a non-integer value. However, since this task is trivial it is left as a voluntary exercise for the reader.
Running a single task on multiple CPUs
You've dealt with parallelisation a little bit already in the array-jobs section. Here we'll cover the key points of another way of parallelising your workflows.
There are two main points to running a task on multiple CPU cores in parallel.
- The tool you are using must be written in a way that it can take advantage of multiple cores i.e is able to parallelize. Reading the tool's documentation is the best source for this kind of information.
- If you request multiple CPUs from Slurm in your batch script, you must also make sure your tool knows that they are available. Some tools have automatic detection for this, for others it has to be explicitly stated.
We'll take a look at a tool of the latter kind.
Complete
- Create a directory named
parallel-jobinto yourlab4directory - Copy into it the batch script named
aln_synth_human.shfrom/gpfs/space/projects/hpc-course/scripts/lab4/ - Look it over, fill out your ETAIS allocation and queue it with the
sbatchcommand
Keeping an eye on your job while it is running
After you've submitted your job, you might want to keep an eye on it and its resource utilisation. The most basic info can be obtained from the squeue command, as you've seen in the array-jobs section... 
...and more verbose output can be obtained with the scontrol show job command. 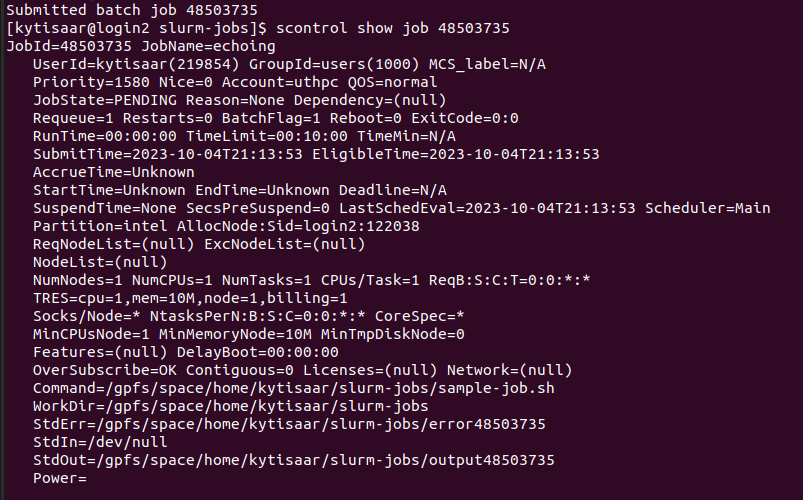
Try it out for yourself:
scontrol show job your_job's_ID
However, if you want to view your job's CPU and RAM utilisation on a graph, you need to look elsewhere. Namely, HPC's Elastic dashboard elk.hpc.ut.ee Open the website in your browser. You can use either University of Tartu or MyAccessId authentication to log in, however for this lab you should use MyAccessId.
A quickstart guide is available in our docs.
As fine-tuning your job's resource allocation is almost always a case of trial and error, having a graph of actual resource utilisation plotted against time can be extremely useful. Below is an example of the same job being ran with various resource allocations. Notice, that in all cases the job makes full use of its CPU allocation, but the RAM allocation has been overshot by nearly a factor of 5.
NB: Both the CPU utilisation and RAM utilisation graphs have a time step of 5 minutes. 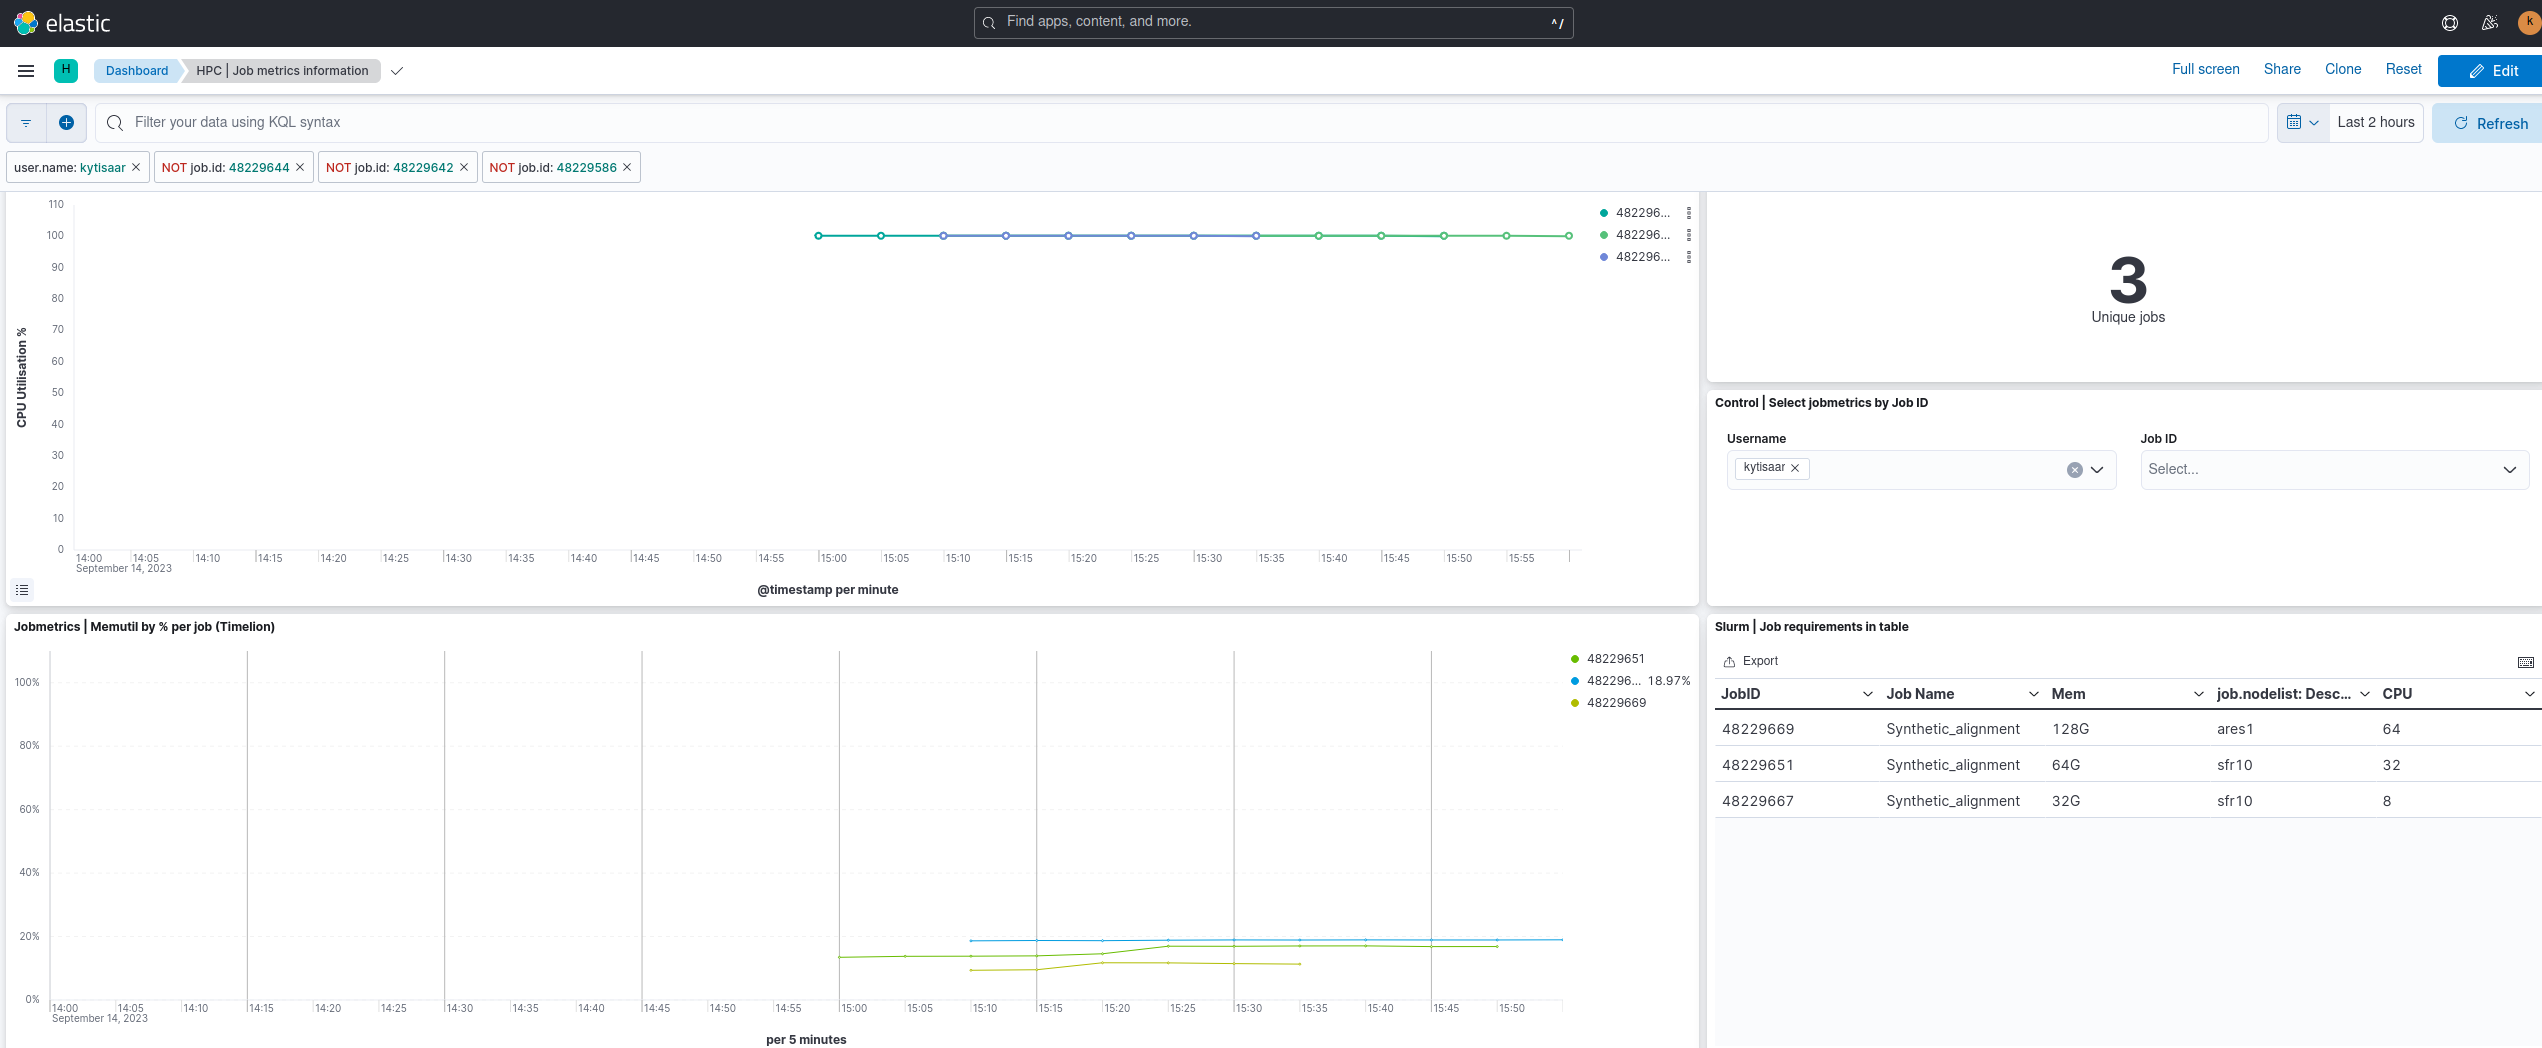 You can experiment with the resource allocations in the
 aln_synth_human.sh script to get it to run as efficiently as possible. There is no check for this. Note the -t option in the script. This is the option that tells the bwa mem tool how many CPU cores it should use.
Extra reading - Failed compression and fast(er) SSD space demonstration
While there are many aspects to running jobs on an HPC cluster, disk bandwidth may be a limiter in some cases. While a single CPU core is capable of churning data around 20Gbit/s, running multiple cores at the same time will usually start hitting hardware limits on the filesystem. Or at least it should
To demonstrate this, I wrote a small script that compared the compression of a single randomly generated text file about 1 GB in size
#!/bin/bash

#SBATCH --partition=amd
#SBATCH --time=10
#SBATCH --ntasks=1
#SBATCH --job-name=compression_test
#SBATCH --cpus-per-task=24
#SBATCH --mem=24g
#SBATCH --account=ealloc_f362e_tommy6

#Regular compression on /gpfs/space
rsync -av /gpfs/space/projects/hpc-course/random_data.txt .
echo Compression on /gpfs/space
time xz --threads=24 random_data.txt

#Transfer to /tmp and compress
JOB_DIR=/tmp/$SLURM_JOB_ID
mkdir $JOB_DIR
chmod 700 $JOB_DIR
rsync -av /gpfs/space/projects/hpc-course/random_data.txt $JOB_DIR/
#Compute using $JOB_DIR for path values
echo Compression on /tmp
time xz --threads=24 $JOB_DIR/random_data.txt
#We would normally rsync the output back, but not necessary here
rm -rf $JOB_DIR
xz was used as it is one of the few compression tools capable of multi-threading. This was tested in 4, 8, 16 and 24 core configurations with varying memory limits since the algorithm gets more memory hungry when running on multiple threads.
After submitting and waiting for the job to finish (was around 2 minutes), we can examine the Slurm log file for output.
sending incremental file list

sent 67 bytes  received 12 bytes  158.00 bytes/sec
total size is 1,073,792,788  speedup is 13,592,313.77
Compression on /gpfs/space
real    0m21.861s
user    7m19.629s
sys     0m2.652s

sending incremental file list
random_data.txt

sent 1,074,055,050 bytes  received 35 bytes  429,622,034.00 bytes/sec
total size is 1,073,792,788  speedup is 1.00
Compression on /tmp
real    0m22.139s
user    7m27.629s
sys     0m1.686s
You are reading it correctly, compression took longer when reading from local fast SSD space. While not an apples-to-apples comparison test, there are probably a few factors related to the inability of reproducing lag on the HPC filesystem. And why this section of the lab is intended more as a reading part.
It is highly likely that in combination with the algorithm used xz and the filesystem tuning parameters, that our storage controllers saw the test file as quite popular and decided to keep it in its RAM for the time being. This, in combination with our InfiniBand network and RDMA capabilities (allows a compute node to read the memory of the controller directly) probably meant that our filesystem was using RAM as its actual location.
Similar tests failed with gzip and the only way to achieve any kind of remarkable results were to run the test on a filesystem that had severely hindered limits in place (10 MB/s total bandwidth). But then the case became hard to demonstrate within meaningful context for this course. Another thing to consider here is the relatively short runtime and small file. Larger files will behave differently and furthermore, there is a small penalty that occurs when transferring the data in and out of /tmp.
The actual key lesson learned here is that for single jobs, the HPC filesystem is fast enough to handle anything thrown at it. This does not mean that it is the case all the time, since the cluster runs a stable 1000 concurrent jobs at any given time, with peaks and lows. Running hundreds of copies of compression has been known to create considerable load on /gpfs/space, and it is still recommended to run larger compression jobs on /tmp.