Monitoring job resource consumption
Slurm jobs run inside an allocation of resources, that's specified when a job runs, inside the ’sbatch’ file. If a job asks for 20 GB of memory, then it gets an allocation of 20 GB of memory. If now this job would try to use 21 GB, then the queueing system kills it, as it doesn't fit into it's allocation.
Sometimes it's fairly difficult to understand how much resources your job uses. This is why UTHPC provides a graphical user interface to explore jobs and their usage consumption.
The service name is Elastic and it's located at https://elk.hpc.ut.ee .
Note
You can login with your University of Tartu username and password.
Users w/o UT credentials can't use this service yet.
Quickstart
Login page should look like this. Use your University of Tartu username first part and password to log in.
Afterwards you should see to your jobs dashboard.
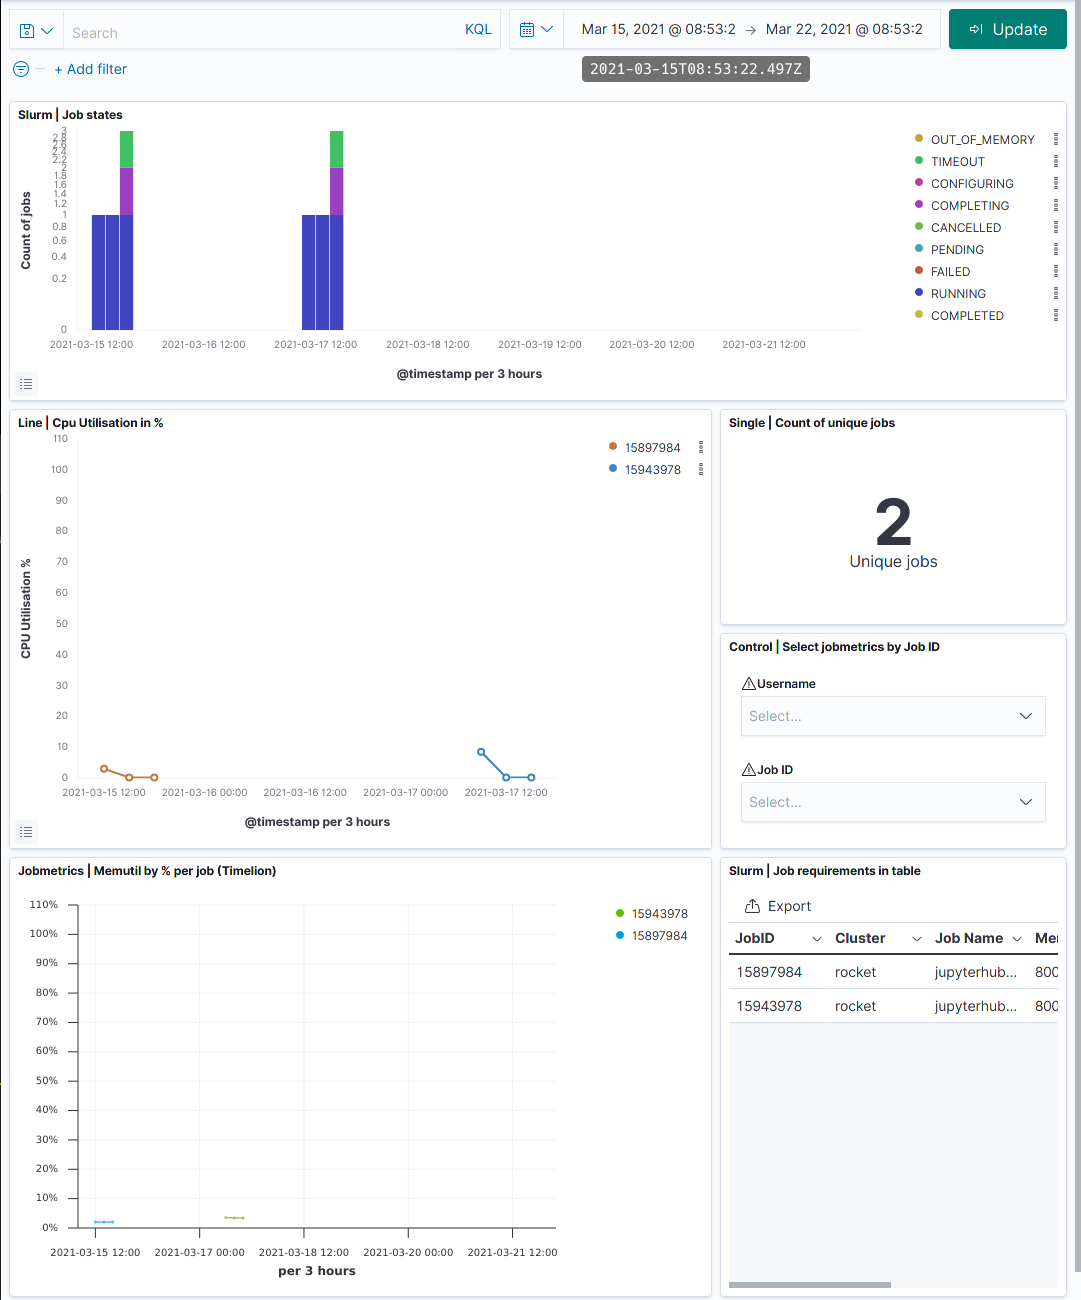
Here you can see the CPU and memory utilization by %, job states, used modules and logs for your jobs. The default time window is 2 days.
Note
Elk gathers information every minute about every job in the Slurm system.
How-to…
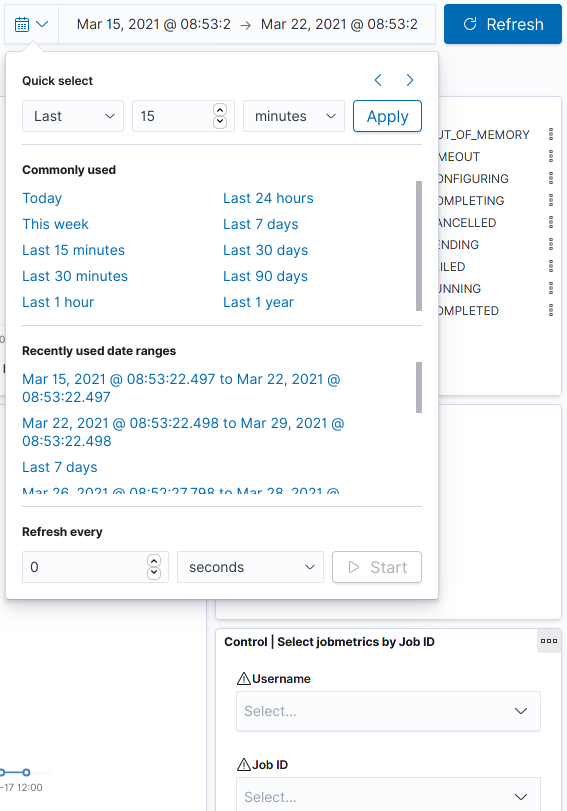
Change your time filter
In the top right part of the dashboard, there is a time filter. You can use this filter to view different or longer periods of time.
View more information about a job
In the bottom of a page, there is a list of events based on the job. In the left side there is a small arrow. Clicking that opens the full document, which allows you to see extra information, including run times and limits.
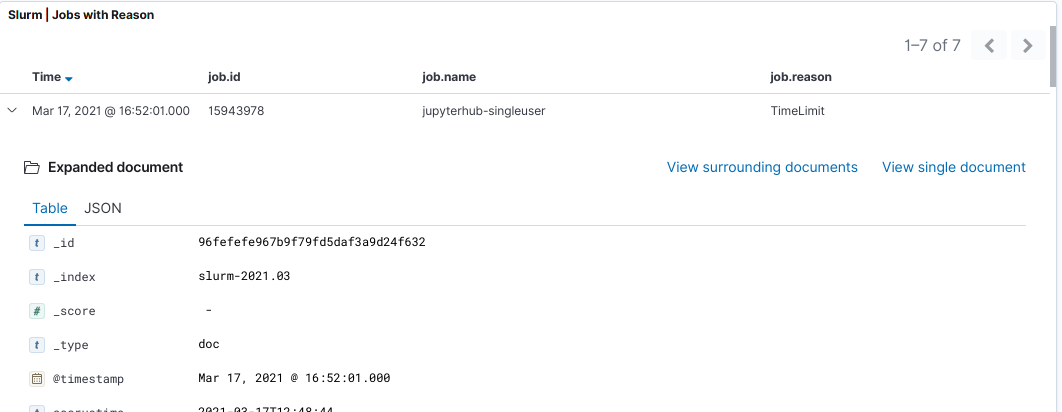
Note
You can get the same with better visibility from ’Menu’ ’Discover’.